 Kountanis
Visualizing Euclidean Rhythms in Python
panos June 21, 2017, midnight
Visualization can help explore the patterns of Euclidean rhythms. Here are some generated .png images using Python and pillow.
Let's start by visualising one pattern at a time (pulses in light pink).
visualize_it(4, 2)

visualize_it(6, 3)

visualize_it(7, 3)

visualize_it(8, 3)

visualize_it(9, 4)

Stacking patterns
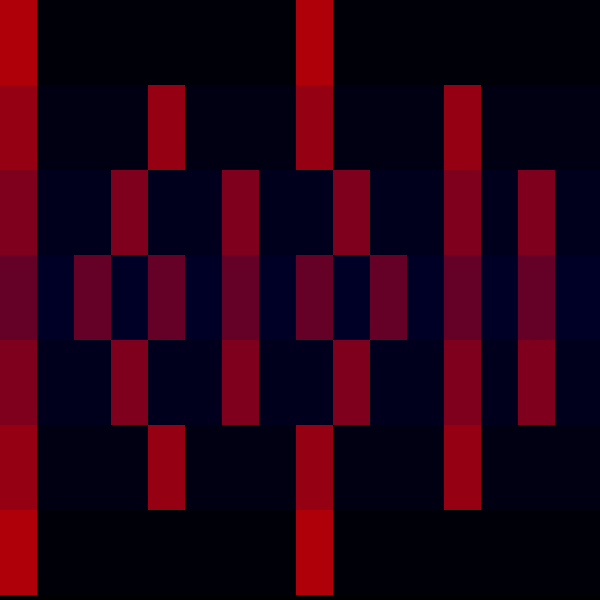
Stacking patterns on top of one another can help us get a feel for how pulses get distributed into beats. When patterns with the same beats are stacked in a mirrored way, interesting geometric patterns are generated:
stacked_same_beat = [
    (16, 2),
    (16, 4),
    (16, 6),
    (16, 16),
    (16, 6),
    (16, 4),
    (16, 2)
]

visualize_many(stacked_same_beat, 600, 600, 'er_stacked_same_beats')
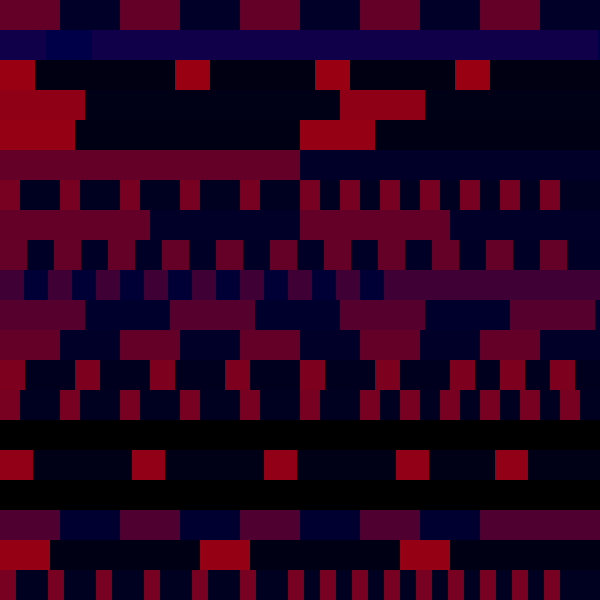
How about rhythms with different beats? The results are more chaotic, but still patternish. This is what stacked Carnatic music might look like, you get different subdivisions of a time interval simultaneously
rhythms = [randpair(randint(3, 23)) for _ in range(20)]
visualize_many(rhythms, 600, 600, 'er_visualize_many')